Skip to main content
Notes
table of contents
Chapter 10
Methods for Comparative Studies
Francis Lau, Anne Holbrook
10.1 Introduction
In eHealth evaluation, comparative studies aim to find out whether group
differences in eHealth system adoption make a difference in important outcomes.
These groups may differ in their composition, the type of system in use, and
the setting where they work over a given time duration. The comparisons are to
determine whether significant differences exist for some predefined measures
between these groups, while controlling for as many of the conditions as
possible such as the composition, system, setting and duration.
According to the typology by Friedman and Wyatt (2006), comparative studies take
on an objective view where events such as the use and effect of an eHealth
system can be defined, measured and compared through a set of variables to
prove or disprove a hypothesis. For comparative studies, the design options are
experimental versus observational and prospective versus retrospective. The quality of eHealth comparative studies depends on such aspects of
methodological design as the choice of variables, sample size, sources of bias,
confounders, and adherence to quality and reporting guidelines.
In this chapter we focus on experimental studies as one type of comparative
study and their methodological considerations that have been reported in the
eHealth literature. Also included are three case examples to show how these
studies are done.
10.2 Types of Comparative Studies
Experimental studies are one type of comparative study where a sample of
participants is identified and assigned to different conditions for a given
time duration, then compared for differences. An example is a hospital with two
care units where one is assigned a CPOE system to process medication orders electronically while the other continues
its usual practice without a CPOE. The participants in the unit assigned to the CPOE are called the intervention group and those assigned to usual practice are the
control group. The comparison can be performance or outcome focused, such as
the ratio of correct orders processed or the occurrence of adverse drug events
in the two groups during the given time period. Experimental studies can take
on a randomized or non-randomized design. These are described below.
10.2.1 Randomized Experiments
In a randomized design, the participants are randomly assigned to two or more
groups using a known randomization technique such as a random number table. The
design is prospective in nature since the groups are assigned concurrently,
after which the intervention is applied then measured and compared. Three types
of experimental designs seen in eHealth evaluation are described below
(Friedman & Wyatt, 2006; Zwarenstein & Treweek, 2009).
Randomized controlled trials(RCTs) – In RCTs participants are randomly assigned to an intervention or a control group. The
randomization can occur at the patient, provider or organization level, which
is known as the unit of allocation. For instance, at the patient level one can
randomly assign half of the patients to receive EMR reminders while the other half do not. At the provider level, one can assign
half of the providers to receive the reminders while the other half continues
with their usual practice. At the organization level, such as a multisite
hospital, one can randomly assign EMR reminders to some of the sites but not others.
Cluster randomized controlled trials (cRCTs) – In cRCTs, clusters of participants are randomized rather than by individual participant
since they are found in naturally occurring groups such as living in the same
communities. For instance, clinics in one city may be randomized as a cluster
to receive EMR reminders while clinics in another city continue their usual practice.
Pragmatic trials – Unlike RCTs that seek to find out if an intervention such as a CPOE system works under ideal conditions, pragmatic trials are designed to find out
if the intervention works under usual conditions. The goal is to make the
design and findings relevant to and practical for decision-makers to apply in
usual settings. As such, pragmatic trials have few criteria for selecting study
participants, flexibility in implementing the intervention, usual practice as
the comparator, the same compliance and follow-up intensity as usual practice,
and outcomes that are relevant to decision-makers.
10.2.2 Non-randomized Experiments
Non-randomized design is used when it is neither feasible nor ethical to
randomize participants into groups for comparison. It is sometimes referred to
as a quasi-experimental design. The design can involve the use of prospective
or retrospective data from the same or different participants as the control
group. Three types of non-randomized designs are described below (Harris et
al., 2006).
Intervention group only with pretest and post-test design – This design involves only one group where a pretest or baseline measure is
taken as the control period, the intervention is implemented, and a post-test
measure is taken as the intervention period for comparison. For example, one
can compare the rates of medication errors before and after the implementation
of a CPOE system in a hospital. To increase study quality, one can add a second pretest
period to decrease the probability that the pretest and post-test difference is
due to chance, such as an unusually low medication error rate in the first
pretest period. Other ways to increase study quality include adding an
unrelated outcome such as patient case-mix that should not be affected,
removing the intervention to see if the difference remains, and removing then
re-implementing the intervention to see if the differences vary accordingly.
Intervention and control groups with post-test design – This design involves two groups where the intervention is implemented in one
group and compared with a second group without the intervention, based on a
post-test measure from both groups. For example, one can implement a CPOE system in one care unit as the intervention group with a second unit as the
control group and compare the post-test medication error rates in both units
over six months. To increase study quality, one can add one or more pretest
periods to both groups, or implement the intervention to the control group at a
later time to measure for similar but delayed effects.
Interrupted time series (ITS) design – In ITS design, multiple measures are taken from one group in equal time intervals,
interrupted by the implementation of the intervention. The multiple pretest and
post-test measures decrease the probability that the differences detected are
due to chance or unrelated effects. An example is to take six consecutive
monthly medication error rates as the pretest measures, implement the CPOE system, then take another six consecutive monthly medication error rates as the
post-test measures for comparison in error rate differences over 12 months. To
increase study quality, one may add a concurrent control group for comparison
to be more convinced that the intervention produced the change.
10.3 Methodological Considerations
The quality of comparative studies is dependent on their internal and external
validity. Internal validity refers to the extent to which conclusions can be
drawn correctly from the study setting, participants, intervention, measures,
analysis and interpretations. External validity refers to the extent to which
the conclusions can be generalized to other settings. The major factors that
influence validity are described below.
10.3.1 Choice of Variables
Variables are specific measurable features that can influence validity. In
comparative studies, the choice of dependent and independent variables and
whether they are categorical and/or continuous in values can affect the type of
questions, study design and analysis to be considered. These are described
below (Friedman & Wyatt, 2006).
Dependent variables – This refers to outcomes of interest; they are also known as outcome variables.
An example is the rate of medication errors as an outcome in determining
whether CPOE can improve patient safety.
Independent variables – This refers to variables that can explain the measured values of the dependent
variables. For instance, the characteristics of the setting, participants and
intervention can influence the effects of CPOE.
Categorical variables – This refers to variables with measured values in discrete categories or levels.
Examples are the type of providers (e.g., nurses, physicians and pharmacists),
the presence or absence of a disease, and pain scale (e.g., 0 to 10 in
increments of 1). Categorical variables are analyzed using non-parametric
methods such as chi-square and odds ratio.
Continuous variables – This refers to variables that can take on infinite values within an interval
limited only by the desired precision. Examples are blood pressure, heart rate
and body temperature. Continuous variables are analyzed using parametric
methods such as t-test, analysis of variance or multiple regression.
10.3.2 Sample Size
Sample size is the number of participants to include in a study. It can refer to
patients, providers or organizations depending on how the unit of allocation is
defined. There are four parts to calculating sample size. They are described
below (Noordzij et al., 2010).
Significance level – This refers to the probability that a positive finding is due to chance alone.
It is usually set at 0.05, which means having a less than 5% chance of drawing
a false positive conclusion.
Power – This refers to the ability to detect the true effect based on a sample from the
population. It is usually set at 0.8, which means having at least an 80% chance
of drawing a correct conclusion.
Effect size – This refers to the minimal clinically relevant difference that can be detected
between comparison groups. For continuous variables, the effect is a numerical
value such as a 10-kilogram weight difference between two groups. For
categorical variables, it is a percentage such as a 10% difference in
medication error rates.
Variability – This refers to the population variance of the outcome of interest, which is
often unknown and is estimated by way of standard deviation (SD) from pilot or previous studies for continuous outcome.
An example of sample size calculation for an RCT to examine the effect of CDS on improving systolic blood pressure of hypertensive patients is provided in the
Appendix. Refer to the Biomath website from Columbia University (n.d.) for a
simple Web-based sample size / power calculator.
10.3.3 Sources of Bias
There are five common sources of biases in comparative studies. They are
selection, performance, detection, attrition and reporting biases (Higgins & Green, 2011). These biases, and the ways to minimize them, are described below
(Vervloet et al., 2012).
Selection or allocation bias – This refers to differences between the composition of comparison groups in
terms of the response to the intervention. An example is having sicker or older
patients in the control group than those in the intervention group when
evaluating the effect of EMR reminders. To reduce selection bias, one can apply randomization and concealment
when assigning participants to groups and ensure their compositions are
comparable at baseline.
Performance bias – This refers to differences between groups in the care they received, aside from
the intervention being evaluated. An example is the different ways by which
reminders are triggered and used within and across groups such as electronic,
paper and phone reminders for patients and providers. To reduce performance
bias, one may standardize the intervention and blind participants from knowing
whether an intervention was received and which intervention was received.
Detection or measurement bias – This refers to differences between groups in how outcomes are determined. An
example is where outcome assessors pay more attention to outcomes of patients
known to be in the intervention group. To reduce detection bias, one may blind
assessors from participants when measuring outcomes and ensure the same timing
for assessment across groups.
Attrition bias – This refers to differences between groups in ways that participants are
withdrawn from the study. An example is the low rate of participant response in
the intervention group despite having received reminders for follow-up care. To
reduce attrition bias, one needs to acknowledge the dropout rate and analyze
data according to an intent-to-treat principle (i.e., include data from those
who dropped out in the analysis).
Reporting bias – This refers to differences between reported and unreported findings. Examples
include biases in publication, time lag, citation, language and outcome
reporting depending on the nature and direction of the results. To reduce
reporting bias, one may make the study protocol available with all
pre-specified outcomes and report all expected outcomes in published results.
10.3.4 Confounders
Confounders are factors other than the intervention of interest that can distort
the effect because they are associated with both the intervention and the
outcome. For instance, in a study to demonstrate whether the adoption of a
medication order entry system led to lower medication costs, there can be a
number of potential confounders that can affect the outcome. These may include
severity of illness of the patients, provider knowledge and experience with the
system, and hospital policy on prescribing medications (Harris et al., 2006).
Another example is the evaluation of the effect of an antibiotic reminder
system on the rate of post-operative deep venous thromboses (DVTs). The confounders can be general improvements in clinical practice during the
study such as prescribing patterns and post-operative care that are not related
to the reminders (Friedman & Wyatt, 2006).
To control for confounding effects, one may consider the use of matching,
stratification and modelling. Matching involves the selection of similar groups
with respect to their composition and behaviours. Stratification involves the
division of participants into subgroups by selected variables, such as
comorbidity index to control for severity of illness. Modelling involves the
use of statistical techniques such as multiple regression to adjust for the
effects of specific variables such as age, sex and/or severity of illness
(Higgins & Green, 2011).
10.3.5 Guidelines on Quality and Reporting
There are guidelines on the quality and reporting of comparative studies. The GRADE (Grading of Recommendations Assessment, Development and Evaluation) guidelines
provide explicit criteria for rating the quality of studies in randomized
trials and observational studies (Guyatt et al., 2011). The extended CONSORT (Consolidated Standards of Reporting Trials) Statements for non-pharmacologic
trials (Boutron, Moher, Altman, Schulz, & Ravaud, 2008), pragmatic trials (Zwarestein et al., 2008), and eHealth
interventions (Baker et al., 2010) provide reporting guidelines for randomized
trials.
The GRADE guidelines offer a system of rating quality of evidence in systematic reviews
and guidelines. In this approach, to support estimates of intervention effects RCTs start as high-quality evidence and observational studies as low-quality
evidence. For each outcome in a study, five factors may rate down the quality
of evidence. The final quality of evidence for each outcome would fall into one
of high, moderate, low, and very low quality. These factors are listed below
(for more details on the rating system, refer to Guyatt et al., 2011).
Design limitations – For RCTs they cover the lack of allocation concealment, lack of blinding, large loss to
follow-up, trial stopped early or selective outcome reporting.
Inconsistency of results – Variations in outcomes due to unexplained heterogeneity. An example is the
unexpected variation of effects across subgroups of patients by severity of
illness in the use of preventive care reminders.
Indirectness of evidence – Reliance on indirect comparisons due to restrictions in study populations,
intervention, comparator or outcomes. An example is the 30-day readmission rate
as a surrogate outcome for quality of computer-supported emergency care in
hospitals.
Imprecision of results – Studies with small sample size and few events typically would have wide
confidence intervals and are considered of low quality.
Publication bias – The selective reporting of results at the individual study level is already
covered under design limitations, but is included here for completeness as it
is relevant when rating quality of evidence across studies in systematic
reviews.
The original CONSORT Statement has 22 checklist items for reporting RCTs. For non-pharmacologic trials extensions have been made to 11 items. For
pragmatic trials extensions have been made to eight items. These items are
listed below. For further details, readers can refer to Boutron and colleagues
(2008) and the CONSORT website (CONSORT, n.d.).
Title and abstract – one item on the means of randomization used.
Introduction – one item on background, rationale, and problem addressed by the intervention.
Methods – 10 items on participants, interventions, objectives, outcomes, sample size,
randomization (sequence generation, allocation concealment, implementation),
blinding (masking), and statistical methods.
Results – seven items on participant flow, recruitment, baseline data, numbers analyzed,
outcomes and estimation, ancillary analyses, adverse events.
Discussion – three items on interpretation, generalizability, overall evidence.
The CONSORT Statement for eHealth interventions describes the relevance of the CONSORT recommendations to the design and reporting of eHealth studies with an emphasis
on Internet-based interventions for direct use by patients, such as online
health information resources, decision aides and PHRs. Of particular importance is the need to clearly define the intervention
components, their role in the overall care process, target population,
implementation process, primary and secondary outcomes, denominators for
outcome analyses, and real world potential (for details refer to Baker et al.,
2010).
10.4 Case Examples
10.4.1 Pragmatic RCT in Vascular Risk Decision Support
Holbrook and colleagues (2011) conducted a pragmatic RCT to examine the effects of a CDS intervention on vascular care and outcomes for older adults. The study is
summarized below.
Setting – Community-based primary care practices with EMRs in one Canadian province.
Participants – English-speaking patients 55 years of age or older with diagnosed vascular
disease, no cognitive impairment and not living in a nursing home, who had a
provider visit in the past 12 months.
Intervention – A Web-based individualized vascular tracking and advice CDS system for eight top vascular risk factors and two diabetic risk factors, for
use by both providers and patients and their families. Providers and staff
could update the patient’s profile at any time and the CDS algorithm ran nightly to update recommendations and colour highlighting used in
the tracker interface. Intervention patients had Web access to the tracker, a
print version mailed to them prior to the visit, and telephone support on
advice.
Design – Pragmatic, one-year, two-arm, multicentre RCT, with randomization upon patient consent by phone, using an
allocation-concealed online program. Randomization was by patient with
stratification by provider using a block size of six. Trained reviewers
examined EMR data and conducted patient telephone interviews to collect risk factors,
vascular history, and vascular events. Providers completed questionnaires on
the intervention at study end. Patients had final 12-month lab checks on urine
albumin, low-density lipoprotein cholesterol, and A1c levels.
Outcomes – Primary outcome was based on change in process composite score (PCS) computed as the sum of frequency-weighted process score for each of the eight
main risk factors with a maximum score of 27. The process was considered met if
a risk factor had been checked. PCS was measured at baseline and study end with the difference as the individual
primary outcome scores. The main secondary outcome was a clinical composite
score (CCS) based on the same eight risk factors compared in two ways: a comparison of the
mean number of clinical variables on target and the percentage of patients with
improvement between the two groups. Other secondary outcomes were actual
vascular event rates, individual PCS and CCS components, ratings of usability, continuity of care, patient ability to manage
vascular risk, and quality of life using the EuroQol five dimensions
questionnaire (EQ-5D).
Analysis – 1,100 patients were needed to achieve 90% power in detecting a one-point PCS difference between groups with a standard deviation of five points, two-tailed t-test for mean difference at 5% significance level, and a withdrawal rate of
10%. The PCS, CCS and EQ-5D scores were analyzed using a generalized estimating equation accounting for
clustering within providers. Descriptive statistics and χ2 tests or exact tests were done with other outcomes.
Findings – 1,102 patients and 49 providers enrolled in the study. The intervention group
with 545 patients had significant PCS improvement with a difference of 4.70 (p < .001) on a 27-point scale. The intervention group also had significantly higher
odds of rating improvements in their continuity of care (4.178, p < .001) and ability to improve their vascular health (3.07, p < .001). There was no significant change in vascular events, clinical variables
and quality of life. Overall the CDS intervention led to reduced vascular risks but not to improved clinical outcomes
in a one-year follow-up.
10.4.2 Non-randomized Experiment in Antibiotic Prescribing in Primary Care
Mainous, Lambourne, and Nietert (2013) conducted a prospective non-randomized
trial to examine the impact of a CDS system on antibiotic prescribing for acute respiratory infections (ARIs) in primary care. The study is summarized below.
Setting – A primary care research network in the United States whose members use a common
EMR and pool data quarterly for quality improvement and research studies.
Participants – An intervention group with nine practices across nine states, and a control
group with 61 practices.
Intervention – Point-of-care CDS tool as customizable progress note templates based on existing EMR features. CDS recommendations reflect Centre for Disease Control and Prevention (CDC) guidelines based on a patient’s predominant presenting symptoms and age. CDS was used to assist in ARI diagnosis, prompt antibiotic use, record diagnosis and treatment decisions, and
access printable patient and provider education resources from the CDC.
Design – The intervention group received a multi-method intervention to facilitate
provider CDS adoption that included quarterly audit and feedback, best practice
dissemination meetings, academic detailing site visits, performance review and CDS training. The control group did not receive information on the intervention,
the CDS or education. Baseline data collection was for three months with follow-up of
15 months after CDS implementation.
Outcomes – The outcomes were frequency of inappropriate prescribing during an ARI episode, broad-spectrum antibiotic use and diagnostic shift. Inappropriate
prescribing was computed by dividing the number of ARI episodes with diagnoses in the inappropriate category that had an antibiotic
prescription by the total number of ARI episodes with diagnosis for which antibiotics are inappropriate. Broad-spectrum
antibiotic use was computed by all ARI episodes with a broad-spectrum antibiotic prescription by the total number of ARI episodes with an antibiotic prescription. Antibiotic drift was computed in two
ways: dividing the number of ARI episodes with diagnoses where antibiotics are appropriate by the total number
of ARI episodes with an antibiotic prescription; and dividing the number of ARI episodes where antibiotics were inappropriate by the total number of ARI episodes. Process measure included frequency of CDS template use and whether the outcome measures differed by CDS usage.
Analysis – Outcomes were measured quarterly for each practice, weighted by the number of ARI episodes during the quarter to assign greater weight to practices with greater
numbers of relevant episodes and to periods with greater numbers of relevant
episodes. Weighted means and 95% CIs were computed separately for adult and pediatric (less than 18 years of age)
patients for each time period for both groups. Baseline means in outcome
measures were compared between the two groups using weighted independent-sample
t-tests. Linear mixed models were used to compare changes over the 18-month
period. The models included time, intervention status, and were adjusted for
practice characteristics such as specialty, size, region and baseline ARIs. Random practice effects were included to account for clustering of repeated
measures on practices over time. P-values of less than 0.05 were considered significant.
Findings – For adult patients, inappropriate prescribing in ARI episodes declined more among the intervention group (-0.6%) than the control
group (4.2%)(p = 0.03), and prescribing of broad-spectrum antibiotics declined by 16.6% in the
intervention group versus an increase of 1.1% in the control group (p < 0.0001). For pediatric patients, there was a similar decline of 19.7% in the
intervention group versus an increase of 0.9% in the control group (p < 0.0001). In summary, the CDS had a modest effect in reducing inappropriate prescribing for adults, but had a
substantial effect in reducing the prescribing of broad-spectrum antibiotics in
adult and pediatric patients.
10.4.3 Interrupted Time Series on EHR Impact in Nursing Care
Dowding, Turley, and Garrido (2012) conducted a prospective ITS study to examine the impact of EHR implementation on nursing care processes and outcomes. The study is summarized
below.
Setting – Kaiser Permanente (KP) as a large not-for-profit integrated healthcare organization in the United
States.
Participants – 29 KP hospitals in the northern and southern regions of California.
Intervention – An integrated EHR system implemented at all hospitals with CPOE, nursing documentation and risk assessment tools. The nursing component for
risk assessment documentation of pressure ulcers and falls was consistent
across hospitals and developed by clinical nurses and informaticists by
consensus.
Design – ITS design with monthly data on pressure ulcers and quarterly data on fall rates and
risk collected over seven years between 2003 and 2009. All data were collected
at the unit level for each hospital.
Outcomes – Process measures were the proportion of patients with a fall risk assessment
done and the proportion with a hospital-acquired pressure ulcer (HAPU) risk assessment done within 24 hours of admission. Outcome measures were fall
and HAPU rates as part of the unit-level nursing care process and nursing sensitive
outcome data collected routinely for all California hospitals. Fall rate was
defined as the number of unplanned descents to the floor per 1,000 patient
days, and HAPU rate was the percentage of patients with stages I-IV or unstageable ulcer on the day of data collection.
Analysis – Fall and HAPU risk data were synchronized using the month in which the EHR was implemented at each hospital as time zero and aggregated across hospitals
for each time period. Multivariate regression analysis was used to examine the
effect of time, region and EHR.
Findings – The EHR was associated with significant increase in document rates for HAPU risk (2.21; 95% CI 0.67 to 3.75) and non-significant increase for fall risk
(0.36; -3.58 to 4.30). The EHR was associated with 13% decrease in HAPU rates (-0.76; -1.37 to -0.16) but no change in fall rates (-0.091; -0.29 to
011). Hospital region was a significant predictor of variation for HAPU (0.72; 0.30 to 1.14) and fall rates (0.57; 0.41 to 0.72). During the study
period, HAPU rates decreased significantly (-0.16; -0.20 to -0.13) but not fall rates
(0.0052; -0.01 to 0.02). In summary, EHR implementation was associated with a reduction in the number of HAPUs but not patient falls, and changes over time and hospital region also affected
outcomes.
10.5 Summary
In this chapter we introduced randomized and non-randomized experimental designs
as two types of comparative studies used in eHealth evaluation. Randomization
is the highest quality design as it reduces bias, but it is not always
feasible. The methodological issues addressed include choice of variables,
sample size, sources of biases, confounders, and adherence to reporting
guidelines. Three case examples were included to show how eHealth comparative
studies are done.
References
Baker, T. B., Gustafson, D. H., Shaw, B., Hawkins, R., Pingree, S., Roberts, L.,
& Strecher, V. (2010). Relevance of CONSORT reporting criteria for research on eHealth interventions. Patient Education and Counselling,81(suppl. 7), 77–86.
Columbia University. (n.d.). Statistics: sample size / power calculation. Biomath (Division of Biomathematics/Biostatistics), Department of Pediatrics. New York:
Columbia University Medical Centre. Retrieved from http://www.biomath.info/power/index.htm
Boutron, I., Moher, D., Altman, D. G., Schulz, K. F., Ravaud, P., & CONSORT Group. (2008). Extending the CONSORT statement to randomized trials of nonpharmacologic treatment: Explanation and
elaboration. Annals of Internal Medicine, 148(4), 295–309.
Cochrane Collaboration. (n.d.). Cochrane handbook. London: Author. Retrieved from http://handbook.cochrane.org/
CONSORT Group. (n.d.). The CONSORT statement. Retrieved from http://www.consort-statement.org/
Dowding, D. W., Turley, M., & Garrido, T. (2012). The impact of an electronic health record on nurse
sensitive patient outcomes: an interrupted time series analysis. Journal of the American Medical Informatics Association, 19(4), 615–620.
Friedman, C. P., & Wyatt, J. C. (2006). Evaluation methods in biomedical informatics (2nd ed.). New York: Springer Science + Business Media, Inc.
Guyatt, G., Oxman, A. D., Akl, E. A., Kunz, R., Vist, G., Brozek, J., … Schunemann, H. J. (2011). GRADE guidelines: 1. Introduction – GRADE evidence profiles and summary of findings tables. Journal of Clinical Epidemiology, 64(4), 383–394.
Harris, A. D., McGregor, J. C., Perencevich, E. N., Furuno, J. P., Zhu, J.,
Peterson, D. E., & Finkelstein, J. (2006). The use and interpretation of quasi-experimental
studies in medical informatics. Journal of the American Medical Informatics Association, 13(1), 16–23.
Higgins, J. P. T., & Green, S. (Eds.). (2011). Cochrane handbook for systematic reviews of interventions (Version 5.1.0, updated March 2011). London: The Cochrane Collaboration.
Retrieved from http://handbook.cochrane.org/
Holbrook, A., Pullenayegum, E., Thabane, L., Troyan, S., Foster, G., Keshavjee,
K., … Curnew, G. (2011). Shared electronic vascular risk decision support in primary
care. Computerization of medical practices for the enhancement of therapeutic
effectiveness (COMPETE III) randomized trial. Archives of Internal Medicine,171(19), 1736–1744.
Mainous III, A. G., Lambourne, C. A., & Nietert, P. J. (2013). Impact of a clinical decision support system on
antibiotic prescribing for acute respiratory infections in primary care:
quasi-experimental trial. Journal of the American Medical Informatics Association, 20(2), 317–324.
Noordzij, M., Tripepi, G., Dekker, F. W., Zoccali, C., Tanck, M. W., & Jager, K. J. (2010). Sample size calculations: basic principles and common
pitfalls. Nephrology Dialysis Transplantation, 25(5), 1388–1393. Retrieved from http://ndt.oxfordjournals.org/content/early/2010/01/12/ndt.gfp732.short
Vervloet, M., Linn, A. J., van Weert, J. C. M., de Bakker, D. H., Bouvy, M. L., & van Dijk, L. (2012). The effectiveness of interventions using electronic
reminders to improve adherence to chronic medication: A systematic review of
the literature. Journal of the American Medical Informatics Association, 19(5), 696–704.
Zwarenstein, M., Treweek, S., Gagnier, J. J., Altman, D. G., Tunis, S., Haynes,
B., Oxman, A. D., & Moher, D., for the CONSORT and Pragmatic Trials in Healthcare (Practihc) groups. (2008). Improving the
reporting of pragmatic trials: an extension of the CONSORT statement. British Medical Journal, 337, a2390. doi: 10.1136/bmj.a2390
Zwarenstein, M., & Treweek, S. (2009). What kind of randomized trials do we need? Canadian Medical Association Journal, 180(10), 998–1000.
Appendix
Example of Sample Size Calculation
This is an example of sample size calculation for an RCT that examines the effect of a CDS system on reducing systolic blood pressure in hypertensive patients. The case is
adapted from the example described in the publication by Noordzij et al. (2010).
(a) Systolic blood pressure as a continuous outcome measured in mmHg
Based on similar studies in the literature with similar patients, the systolic
blood pressure values from the comparison groups are expected to be normally
distributed with a standard deviation of 20 mmHg. The evaluator wishes to
detect a clinically relevant difference of 15 mmHg in systolic blood pressure
as an outcome between the intervention group with CDS and the control group without CDS. Assuming a significance level or alpha of 0.05 for 2-tailed t-test and power of 0.80, the corresponding multipliers1 are 1.96 and 0.842, respectively. Using the sample size equation for continuous
outcome below we can calculate the sample size needed for the above study.
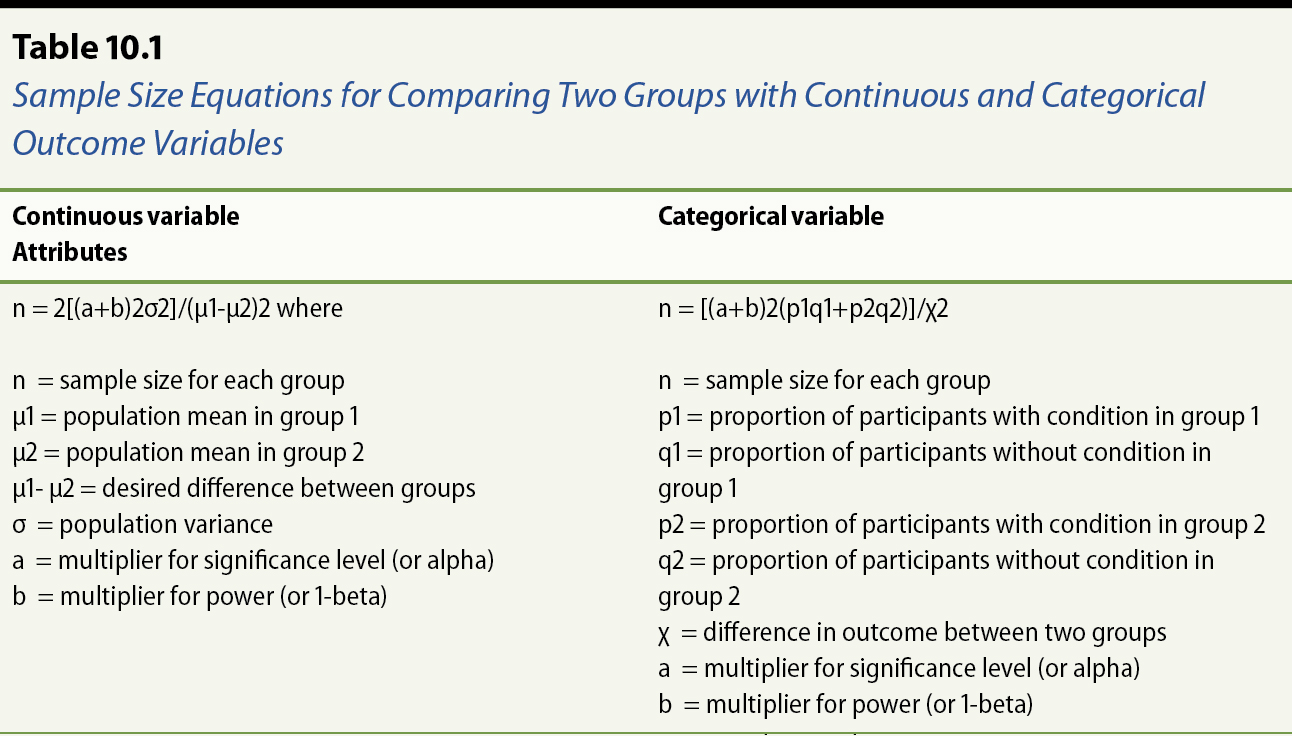
n = 2[(a+b)2σ2]/(μ1-μ2)2 where
n = sample size for each group
μ1 = population mean of systolic blood pressures in intervention group
μ2 = population mean of systolic blood pressures in control group
μ1- μ2 = desired difference in mean systolic blood pressures between groups
σ = population variance
a = multiplier for significance level (or alpha)
b = multiplier for power (or 1-beta)
Providing the values in the equation would give the sample size (n) of 28
samples per group as the result
n = 2[(1.96+0.842)2(202)]/152 or 28 samples per group
(b) Systolic blood pressure as a categorical outcome measured as below or above
140 mmHg (i.e., hypertension yes/no)
In this example a systolic blood pressure from a sample that is above 140 mmHg
is considered an event of the patient with hypertension. Based on published
literature the proportion of patients in the general population with
hypertension is 30%. The evaluator wishes to detect a clinically relevant
difference of 10% in systolic blood pressure as an outcome between the
intervention group with CDS and the control group without CDS. This means the expected proportion of patients with hypertension is 20% (p1 =
0.2) in the intervention group and 30% (p2 = 0.3) in the control group.
Assuming a significance level or alpha of 0.05 for 2-tailed t-test and power of 0.80 the corresponding multipliers are 1.96 and 0.842,
respectively. Using the sample size equation for categorical outcome below, we
can calculate the sample size needed for the above study.
n = [(a+b)2(p1q1+p2q2)]/χ2
n = sample size for each group
p1 = proportion of patients with hypertension in intervention group
q1 = proportion of patients without hypertension in intervention group (or 1-p1)
p2 = proportion of patients with hypertension in control group
q2 = proportion of patients without hypertension in control group (or 1-p2)
χ = desired difference in proportion of hypertensive patients between two groups
a = multiplier for significance level (or alpha)
b = multiplier for power (or 1-beta)
Providing the values in the equation would give the sample size (n) of 291
samples per group as the result
n = [(1.96+0.842)2((0.2)(0.8)+(0.3)(0.7))]/(0.1)2 or 291 samples per group
1 From Table 3 on p. 1392 of Noordzij et al. (2010).
Annotate
EPUB